
Using the validation_curve() function in scikit-learn helps in evaluating model performance by tuning hyperparameters efficiently.
This function generates training and test scores for different hyperparameter values, aiding in understanding how changes in a hyperparameter affect the model’s performance.
The validation_curve() function tests different values of a specific hyperparameter for an estimator. It’s applicable to any supervised learning problem, such as classification or regression.
from sklearn.datasets import make_classification
from sklearn.model_selection import validation_curve
from sklearn.linear_model import LogisticRegression
import matplotlib.pyplot as plt
import numpy as np
# generate binary classification dataset
X, y = make_classification(n_samples=100, n_features=50, n_classes=2, random_state=1)
# define model
model = LogisticRegression()
# define range of hyperparameter values
param_range = np.logspace(-6, -1, 5)
# calculate validation curve
train_scores, test_scores = validation_curve(
model, X, y, param_name='C', param_range=param_range, cv=5, scoring='accuracy')
# calculate mean and standard deviation for training set scores
train_mean = np.mean(train_scores, axis=1)
train_std = np.std(train_scores, axis=1)
# calculate mean and standard deviation for test set scores
test_mean = np.mean(test_scores, axis=1)
test_std = np.std(test_scores, axis=1)
# plot validation curve
plt.plot(param_range, train_mean, label='Training score', color='r')
plt.plot(param_range, test_mean, label='Cross-validation score', color='g')
# plot error bars
plt.fill_between(param_range, train_mean - train_std, train_mean + train_std, color='r', alpha=0.2)
plt.fill_between(param_range, test_mean - test_std, test_mean + test_std, color='g', alpha=0.2)
# create plot
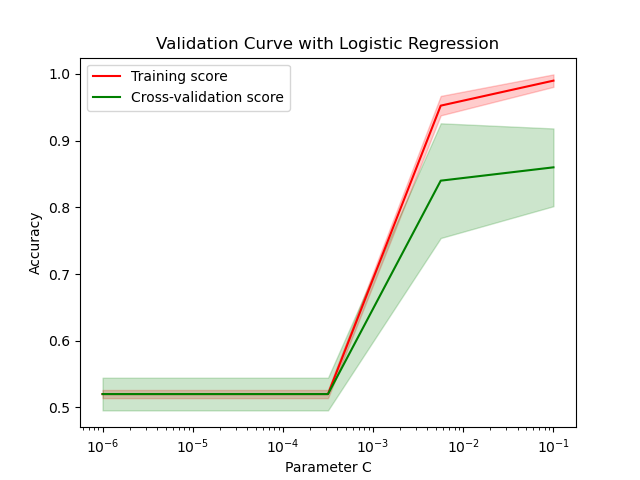
plt.title('Validation Curve with Logistic Regression')
plt.xlabel('Parameter C')
plt.ylabel('Accuracy')
plt.legend(loc='best')
plt.xscale('log')
plt.show()
Running the example gives an output like:
The steps are as follows:
A synthetic binary classification dataset is generated using
make_classification(). This function creates a dataset with a specified number of samples (n_samples), classes (n_classes), and a fixed random seed (random_state) for reproducibility.A
LogisticRegressionmodel is instantiated.A range of values for the hyperparameter
Cis defined usingnp.logspace().The
validation_curve()function is used to compute training and test scores across different values ofCwith 5-fold cross-validation. The function calculates these scores by varying the hyperparameter and evaluating the model’s performance on each fold.The mean and standard deviation of the training and test scores are calculated to summarize the performance across different folds.
A validation curve is plotted, showing training and cross-validation scores with error bars to visualize the variability. The plot helps in identifying the optimal range of the hyperparameter by comparing the training and test performance.
This example demonstrates how to use validation_curve() to evaluate the effect of different hyperparameter values on model performance, facilitating better hyperparameter tuning in scikit-learn.