
Quantile transformation is a data preprocessing technique that maps data to follow a uniform or normal distribution. This can help improve the performance of machine learning models by normalizing feature distributions.
The key parameters of quantile_transform() include output_distribution, which determines the target distribution (uniform or normal), and n_quantiles, which specifies the number of quantiles to compute.
This technique is appropriate for preprocessing data in classification, regression, and clustering tasks where feature scaling and distribution normalization are beneficial.
from sklearn.datasets import make_classification
from sklearn.preprocessing import quantile_transform
import matplotlib.pyplot as plt

# generate a synthetic dataset
X, y = make_classification(n_samples=100, n_informative=2, n_redundant=0, n_features=2, random_state=1)

# apply quantile transform
X_transformed = quantile_transform(X, output_distribution='normal')

# plot the original and transformed data
fig, ax = plt.subplots(1, 2, figsize=(12, 6))
ax[0].scatter(X[:, 0], X[:, 1], c=y, cmap='viridis')
ax[0].set_title('Original Data')
ax[1].scatter(X_transformed[:, 0], X_transformed[:, 1], c=y, cmap='viridis')
ax[1].set_title('Transformed Data')
plt.show()
Running the example gives an output like:
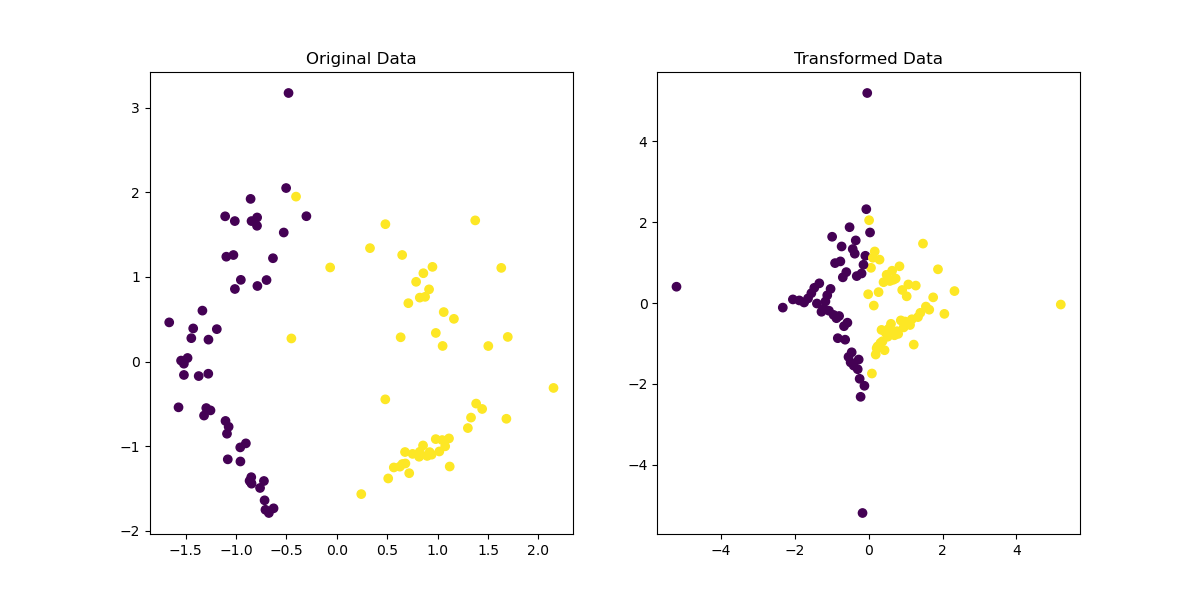
The steps are as follows:
First, a synthetic dataset is generated using the
make_classification()function. This creates a dataset with a specified number of samples (n_samples) and features (n_features), and a fixed random seed (random_state) for reproducibility.The
quantile_transform()function is applied to the dataset. This function transforms the features to follow a uniform or normal distribution. In this example, theoutput_distributionparameter is set to ’normal’, mapping the data to a Gaussian distribution.The original and transformed datasets are plotted side-by-side for visual comparison. The original data is displayed in one plot, and the transformed data is shown in the other plot, demonstrating the effect of the quantile transformation.
This example demonstrates how to use quantile_transform() for data preprocessing, which can help improve the performance of machine learning models by normalizing the feature distribution.