
Evaluating the trade-off between precision and recall is crucial for binary classification models, especially when dealing with imbalanced datasets. The precision_recall_curve() function in scikit-learn helps visualize this trade-off.
Precision-recall curves illustrate how precision (the ratio of true positives to the sum of true positives and false positives) and recall (the ratio of true positives to the sum of true positives and false negatives) vary with different threshold settings. High precision and recall indicate a model that correctly identifies most positive instances without many false positives. Poor values suggest either many false positives or many missed positives.
Precision-recall curves are particularly useful for binary classification problems with imbalanced datasets, where the positive class is less frequent. However, they are not useful for multiclass classification without adaptations and can be misleading if not interpreted with other metrics.
from sklearn.datasets import make_classification
from sklearn.model_selection import train_test_split
from sklearn.linear_model import LogisticRegression
from sklearn.metrics import precision_recall_curve
import matplotlib.pyplot as plt

# Generate synthetic dataset
X, y = make_classification(n_samples=1000, n_classes=2, weights=[0.9, 0.1], random_state=42)

# Split into train and test sets
X_train, X_test, y_train, y_test = train_test_split(X, y, test_size=0.2, random_state=42)

# Train a logistic regression classifier
clf = LogisticRegression(random_state=42)
clf.fit(X_train, y_train)

# Predict probabilities on the test set
y_probs = clf.predict_proba(X_test)[:, 1]

# Calculate precision-recall pairs for different thresholds
precision, recall, thresholds = precision_recall_curve(y_test, y_probs)

# Plot the precision-recall curve
plt.plot(recall, precision, marker='.')
plt.xlabel('Recall')
plt.ylabel('Precision')
plt.title('Precision-Recall Curve')
plt.show()
Running the example gives an output like:
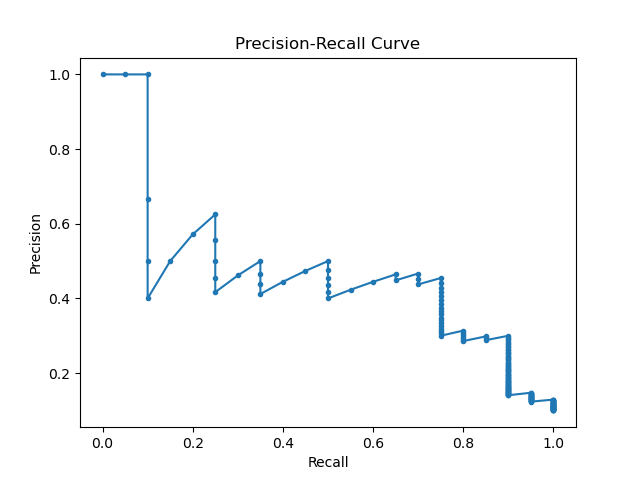
The steps are as follows:
- Generate a synthetic binary classification dataset using the
make_classification()function with 1000 samples and imbalanced class weights (90% negative, 10% positive). - Split the dataset into training and test sets using
train_test_split()to ensure the model is evaluated on unseen data. - Train a logistic regression classifier with the training set using the
LogisticRegressionclass. - Predict the probability of the positive class for the test set samples using
predict_proba(). - Use the
precision_recall_curve()function to compute precision and recall values for different probability thresholds. - Plot the resulting precision-recall curve to visualize the trade-off between precision and recall using
matplotlib.
This example demonstrates how to use the precision_recall_curve() function from scikit-learn to evaluate the performance of a binary classification model, particularly useful for imbalanced datasets.