
Transforming data to follow a Gaussian distribution can improve the performance of many machine learning algorithms. The PowerTransformer in scikit-learn applies a power transformation to each feature, making the data more Gaussian-like.
The key hyperparameters of PowerTransformer include the method (type of power transformation, such as ‘yeo-johnson’ or ‘box-cox’) and standardize (whether to standardize the data after transformation).
This algorithm is suitable for preprocessing data before modeling for regression, classification, and clustering tasks.
from sklearn.datasets import make_classification
from sklearn.preprocessing import PowerTransformer
import matplotlib.pyplot as plt
import numpy as np
# generate a synthetic dataset
X, _ = make_classification(n_samples=100, n_features=2, n_informative=2, n_redundant=0, random_state=1)
X = np.exp(X) # add skewness to the distribution
# create PowerTransformer
pt = PowerTransformer(method='yeo-johnson')
# fit and transform the dataset
X_trans = pt.fit_transform(X)
# plot before and after transformation
fig, ax = plt.subplots(1, 2, figsize=(12, 5))
# original data
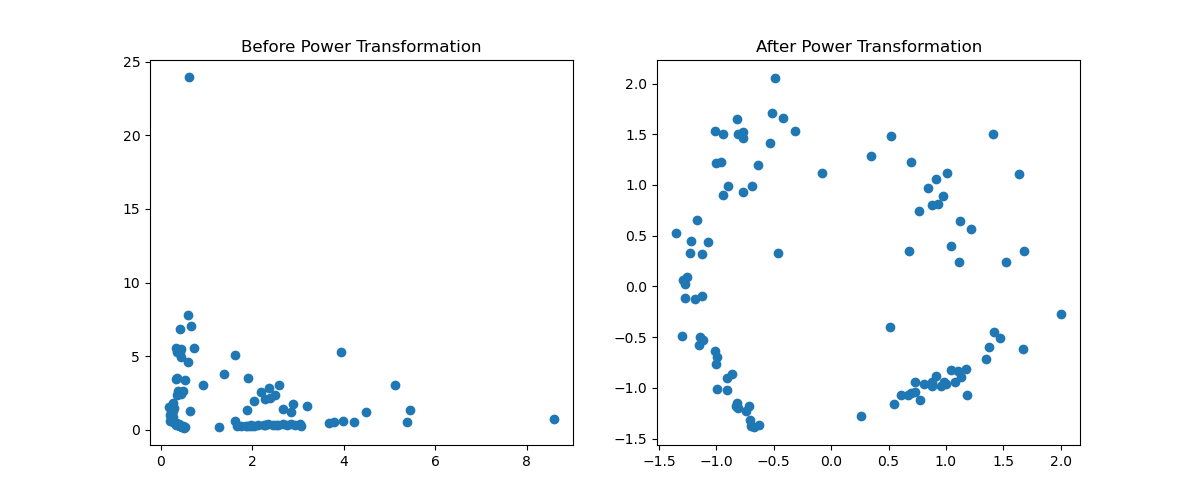
ax[0].scatter(X[:, 0], X[:, 1])
ax[0].set_title('Before Power Transformation')
# transformed data
ax[1].scatter(X_trans[:, 0], X_trans[:, 1])
ax[1].set_title('After Power Transformation')
plt.show()
Running the example gives an output like:
The steps are as follows:
Generate a synthetic dataset using
make_classification(). This function creates a dataset with a specified number of samples and features, with a fixed random seed for reproducibility.Instantiate
PowerTransformerwith the method set to ‘yeo-johnson’. This method is chosen for its flexibility in handling both positive and negative values.Fit and transform the dataset using the
PowerTransformer. Thefit_transform()method learns the parameters for the power transformation and applies it to the data.Plot the data before and after the transformation to visualize the effect. The
scatter()function frommatplotlibis used to create scatter plots of the original and transformed data.
This example demonstrates how to use PowerTransformer to preprocess data, making it more suitable for machine learning algorithms by stabilizing variance and making the data distribution more Gaussian-like. This transformation can help improve the performance of algorithms that assume a normal distribution of the input data.