Power transformation is a technique used to stabilize variance, make the data more Gaussian-like, and improve the performance of downstream algorithms.
The power_transform() function in scikit-learn can apply either a Box-Cox or Yeo-Johnson transformation to the data.
This transformation is particularly useful for data preprocessing in regression and classification tasks where the features do not follow a normal distribution.
from sklearn.datasets import make_regression
from sklearn.preprocessing import power_transform
import matplotlib.pyplot as plt
import numpy as np

# generate regression dataset
X, y = make_regression(n_samples=100, n_features=1, noise=0.1, random_state=1)
X = np.exp(X)  # add skewness to the distribution

# plot before transformation
plt.subplot(1, 2, 1)
plt.hist(X, bins=30)
plt.title('Before Power Transform')

# apply power transform
X_transformed = power_transform(X, method='yeo-johnson')

# plot after transformation
plt.subplot(1, 2, 2)
plt.hist(X_transformed, bins=30)
plt.title('After Power Transform')

plt.show()
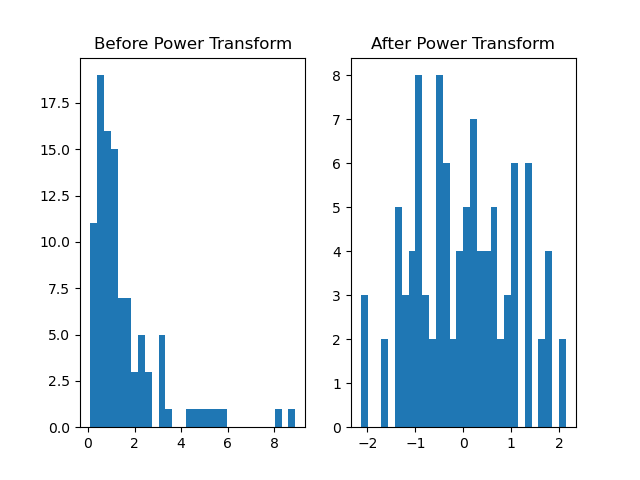
Running the example gives an output like:

The steps are as follows:
First, generate a synthetic regression dataset using
make_regression(). This creates a dataset with a specified number of samples (n_samples), features (n_features), and a fixed random seed (random_state) for reproducibility.Plot the distribution of the dataset before applying the transformation using
matplotlib.Apply the
power_transform()function to the dataset, specifying themethodparameter as'yeo-johnson'.Plot the distribution of the dataset after applying the transformation using
matplotlibto visually assess the changes.
This example demonstrates how to use power_transform() to preprocess data by stabilizing variance and making the data more Gaussian-like, which can improve the performance of downstream machine learning algorithms.
