
Principal Component Analysis (PCA) is used for dimensionality reduction, helping to simplify data while preserving as much variability as possible. PCA transforms the data to a new coordinate system where the greatest variances come to lie on the first coordinates (principal components).
The key hyperparameters of PCA include n_components (number of components to keep) and svd_solver (algorithm to perform the decomposition).
The algorithm is suitable for preprocessing in both classification and regression tasks, especially when dealing with high-dimensional data.
from sklearn.datasets import make_classification
from sklearn.model_selection import train_test_split
from sklearn.decomposition import PCA
from matplotlib import pyplot as plt
# generate dataset
X, y = make_classification(n_samples=100, n_features=10, random_state=1)
# split into train and test sets
X_train, X_test, y_train, y_test = train_test_split(X, y, test_size=0.2, random_state=1)
# apply PCA
pca = PCA(n_components=2)
X_train_pca = pca.fit_transform(X_train)
X_test_pca = pca.transform(X_test)
# plot the transformed dataset
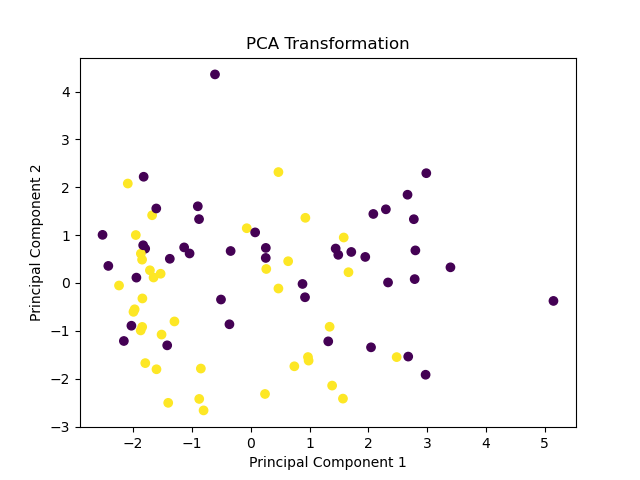
plt.scatter(X_train_pca[:, 0], X_train_pca[:, 1], c=y_train)
plt.xlabel('Principal Component 1')
plt.ylabel('Principal Component 2')
plt.title('PCA Transformation')
plt.show()
Running the example produces a scatter plot that visualizes the first two principal components of the transformed training data, showing how PCA reduces dimensionality while preserving class separation.
The steps are as follows:
- Generate a synthetic dataset with 10 features and 100 samples using
make_classification(). This simulates a high-dimensional dataset. - Split the dataset into training and test sets using
train_test_split(). - Create a
PCAobject withn_components=2to reduce the dataset to 2 dimensions. - Fit the
PCAmodel on the training data and transform both the training and test datasets usingfit_transform()andtransform(), respectively. - Plot the first two principal components of the transformed training data to visualize the reduced dimensionality and class separation.
This example demonstrates how to effectively use PCA for dimensionality reduction, showcasing its ability to simplify high-dimensional data while maintaining important information.