
OPTICS (Ordering Points To Identify the Clustering Structure) is a density-based clustering algorithm that can identify clusters of varying densities. Unlike other clustering algorithms, OPTICS does not require the number of clusters to be specified beforehand.
The key hyperparameters of OPTICS include min_samples (minimum number of samples in a neighborhood for a point to be considered a core point), xi (steepness threshold for significant changes in reachability), and min_cluster_size (minimum size of clusters).
The algorithm is appropriate for clustering tasks with varied densities, such as identifying regions of high and low density in spatial data.
from sklearn.datasets import make_blobs
from sklearn.cluster import OPTICS
import matplotlib.pyplot as plt
# generate a synthetic dataset with 3 clusters
X, _ = make_blobs(n_samples=300, centers=3, cluster_std=0.5, random_state=0)
# create and fit the model
model = OPTICS(min_samples=10, xi=0.05, min_cluster_size=0.1)
model.fit(X)
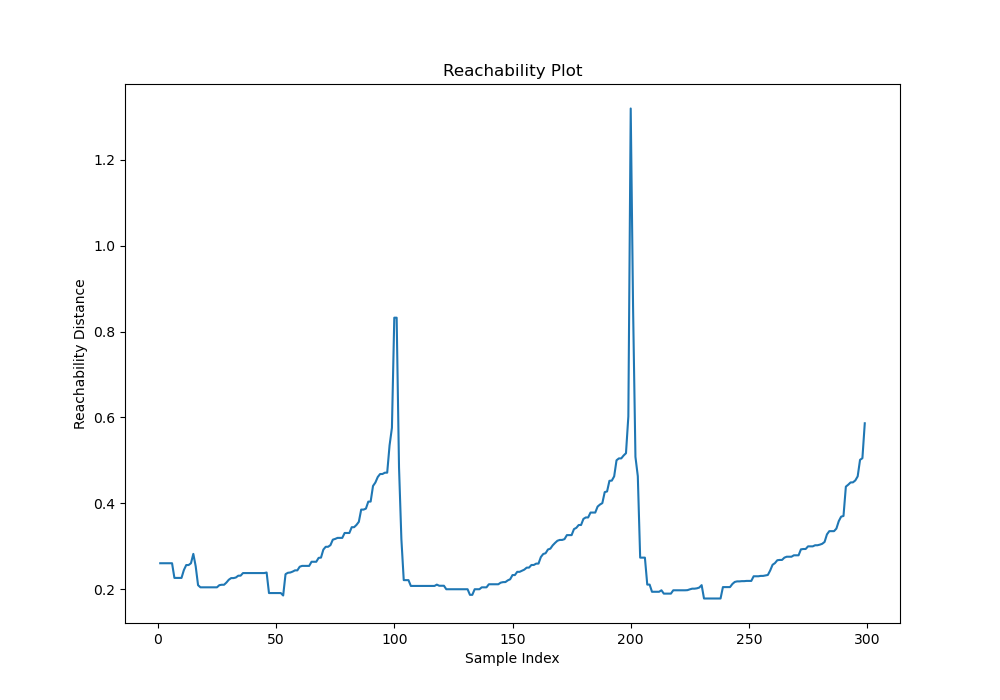
# plot the reachability plot
plt.figure(figsize=(10, 7))
plt.plot(model.reachability_[model.ordering_])
plt.title('Reachability Plot')
plt.xlabel('Sample Index')
plt.ylabel('Reachability Distance')
plt.show()
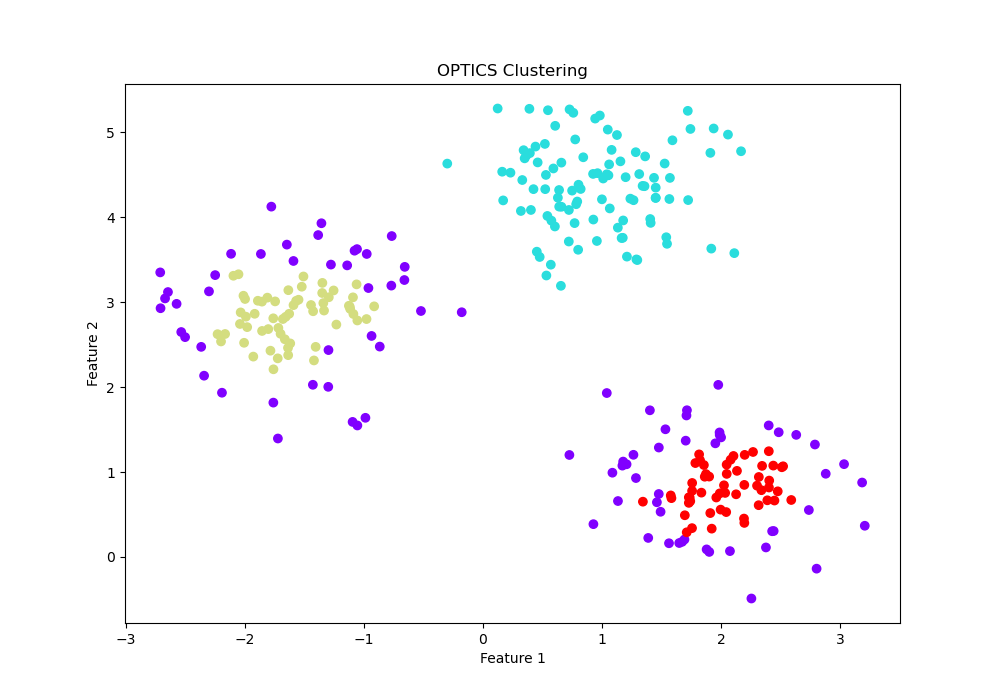
# extract clusters
labels = model.labels_
# plot the clusters
plt.figure(figsize=(10, 7))
plt.scatter(X[:, 0], X[:, 1], c=labels, cmap='rainbow')
plt.title('OPTICS Clustering')
plt.xlabel('Feature 1')
plt.ylabel('Feature 2')
plt.show()
Running the example gives an output like:
The steps are as follows:
First, a synthetic dataset with 3 clusters is generated using the
make_blobs()function. This creates a dataset with a specified number of samples (n_samples), centers (centers), and a fixed random seed (random_state) for reproducibility.Next, an
OPTICSmodel is instantiated with specific hyperparameters (min_samples,xi,min_cluster_size). The model is then fit on the dataset using thefit()method.The reachability distances are plotted to visualize the clustering structure. This helps in understanding the density-based structure of the data.
The cluster labels assigned by
OPTICSare extracted and used to plot the clusters, providing a visual representation of the clustering results.
This example demonstrates how to use the OPTICS algorithm for clustering data with varied densities, highlighting its flexibility and effectiveness in scikit-learn. The OPTICS algorithm is particularly useful for discovering clusters in datasets where the cluster densities vary significantly.