
MeanShift is a clustering algorithm used for finding dense areas of data points in an unsupervised manner.
It iteratively shifts data points towards the mode of the data distribution.
The key hyperparameter for MeanShift is bandwidth, which defines the radius of the region used to compute the mean shift. This algorithm is suitable for clustering tasks where the number of clusters is not predefined.
from sklearn.datasets import make_blobs
from sklearn.cluster import MeanShift
import numpy as np
import matplotlib.pyplot as plt

# generate a sample dataset
X, _ = make_blobs(n_samples=300, centers=4, cluster_std=0.60, random_state=0)

# define the model
model = MeanShift(bandwidth=1.0)

# fit model
model.fit(X)

# assign a cluster to each example
yhat = model.predict(X)

# retrieve unique clusters
clusters = np.unique(yhat)

# create scatter plot for samples from each cluster
for cluster in clusters:
    row_ix = np.where(yhat == cluster)
    plt.scatter(X[row_ix, 0], X[row_ix, 1])

# show the plot
plt.show()

# make a prediction
sample = [[0, 0]]
yhat_sample = model.predict(sample)
print('Predicted cluster for sample:', yhat_sample[0])
Running the example gives an output like:
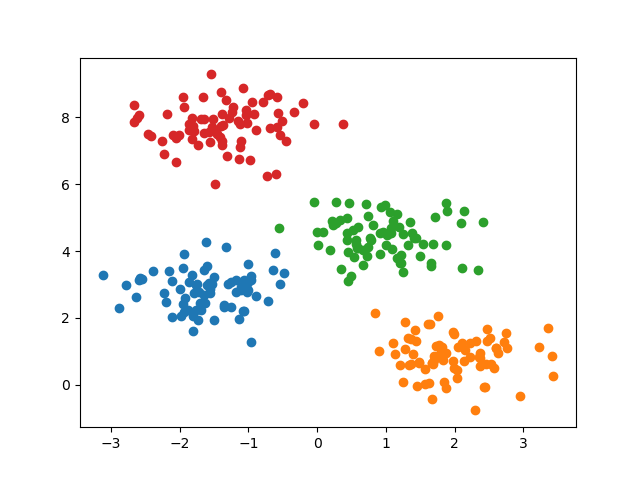
The steps are as follows:
A synthetic dataset is generated with multiple blobs using the
make_blobs()function. This creates a dataset with a specified number of samples (n_samples), cluster centers (centers), and a fixed random seed (random_state) for reproducibility. The dataset is used to demonstrate the clustering process.Next, a
MeanShiftmodel is instantiated with thebandwidthhyperparameter set to 1.0. Thebandwidthdefines the radius of the region used to compute the mean shift.The
MeanShiftmodel is fit on the synthetic dataset using thefit()method, which clusters the data points.The
predict()method is used to assign each data point to a cluster, and the unique clusters are identified usingnp.unique().A scatter plot is created to visualize the clustered data points, with each cluster represented by a different color.
A prediction is made for a new sample data point to determine its cluster assignment using the
predict()method.
This example demonstrates how to use the MeanShift algorithm for clustering tasks in scikit-learn, showcasing its ability to find dense areas of data points without requiring a predefined number of clusters.