
The Swiss Roll dataset is a synthetic dataset useful for visualizing and testing manifold learning algorithms.
Key arguments when generating the dataset include n_samples to specify the number of samples, noise to add Gaussian noise, and random_state for reproducibility.
This dataset is suitable for clustering and dimensionality reduction algorithms such as k-means and t-SNE.
from sklearn.datasets import make_swiss_roll
import matplotlib.pyplot as plt
import pandas as pd
# Generate the dataset
n_samples = 1000
noise = 0.2
X, t = make_swiss_roll(n_samples=n_samples, noise=noise, random_state=42)
# Display dataset shape and types
print(f"Dataset shape: {X.shape}")
print(f"Feature types: {type(X)}")
# Show summary statistics
print(f"Summary statistics:\n{pd.DataFrame(X).describe()}")
# Plot the dataset
fig = plt.figure(figsize=(10, 7))
ax = fig.add_subplot(111, projection='3d')
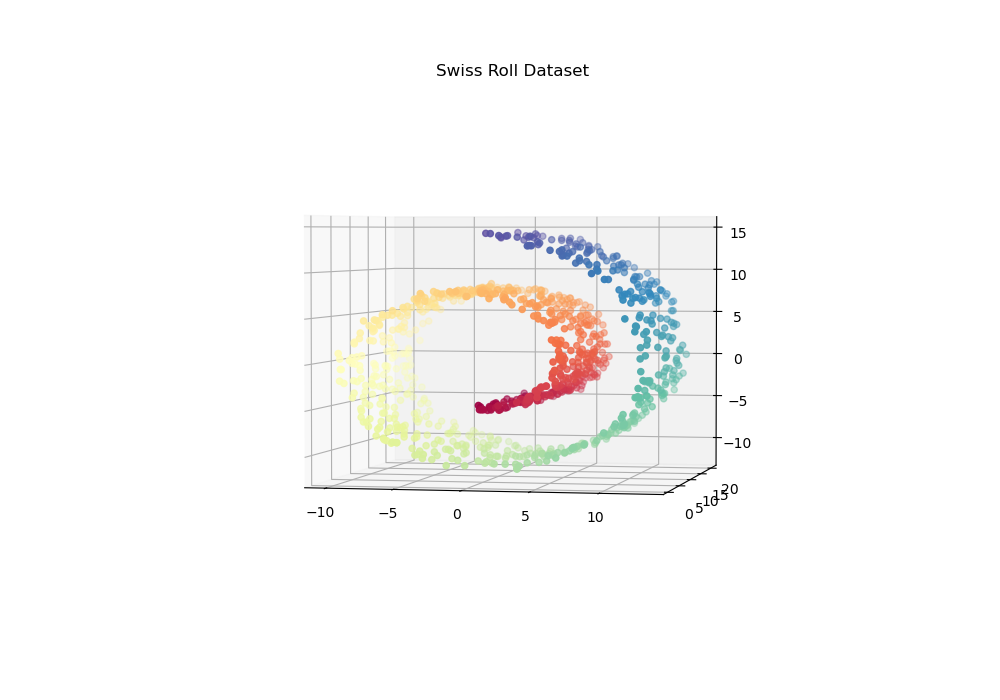
ax.scatter(X[:, 0], X[:, 1], X[:, 2], c=t, cmap=plt.cm.Spectral)
plt.title("Swiss Roll Dataset")
plt.show()
Running the example gives an output like:
Dataset shape: (1000, 3)
Feature types: <class 'numpy.ndarray'>
Summary statistics:
                 0            1            2
count  1000.000000  1000.000000  1000.000000
mean      2.004806    10.647835     0.154515
std       6.571050     6.149676     6.913291
min      -9.919520    -0.144537   -11.416802
25%      -3.386741     5.106111    -4.763130
50%       3.317279    10.890549    -0.511495
75%       6.315301    15.915352     6.430505
max      12.928036    21.176402    14.360618
The steps are as follows:
Import the
make_swiss_rollfunction fromsklearn.datasetsandmatplotlib.pyplotfor plotting:- This function generates the Swiss Roll dataset, and matplotlib is used for visualization.
Generate the dataset using
make_swiss_roll():- Specify the number of samples (
n_samples), noise level (noise), and random state (random_state).
- Specify the number of samples (
Print the dataset shape and feature types:
- Access the shape using
X.shape. - Show the data type of the features, which is typically a numpy array.
- Access the shape using
Display summary statistics:
- Use
pd.DataFrame(X).describe()to get a statistical summary of the dataset.
- Use
Plot the dataset:
- Create a 3D scatter plot using matplotlib to visualize the Swiss Roll structure.
- Use the
cparameter to color the points based on thetvalues.
This example demonstrates how to quickly generate and visualize the Swiss Roll dataset using scikit-learn’s make_swiss_roll function. This is useful for testing clustering and dimensionality reduction algorithms.