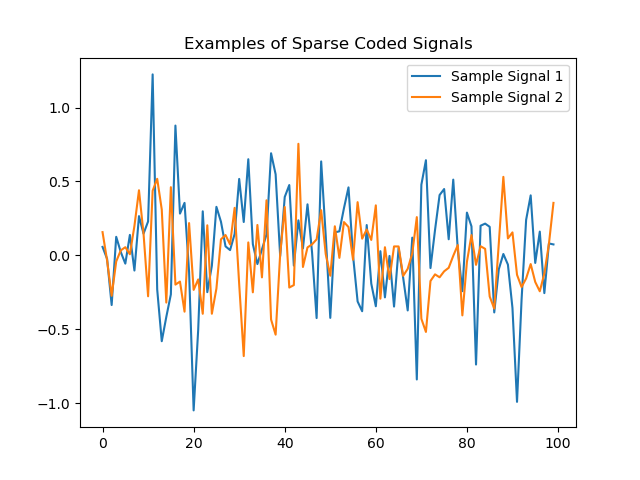
This example demonstrates how to use the make_sparse_coded_signal() function from scikit-learn to generate a synthetic dataset. This function creates a sparse coded signal, which is useful for tasks related to signal processing and sparse coding.
The make_sparse_coded_signal() function generates a signal that can be approximated by a sparse combination of basis functions. Key function arguments include n_samples for the number of samples, n_components for the number of components in the signal, and n_features for the number of features.
This dataset is typically used in problems involving sparse coding and dictionary learning algorithms.
from sklearn.datasets import make_sparse_coded_signal
import matplotlib.pyplot as plt
import pandas as pd

# Generate the dataset
Y, D, X = make_sparse_coded_signal(n_samples=100, n_components=30, n_features=50, n_nonzero_coefs=5, random_state=0)

# Display dataset shape
print(f"Y shape: {Y.shape}")
print(f"D shape: {D.shape}")
print(f"X shape: {X.shape}")

# Show summary statistics of the signal
print(f"Summary statistics of Y:\n{pd.DataFrame(Y).describe()}")

# Display the first few values of the signal
print(f"First few columns of Y:\n{Y[:, :5]}")

# Plot examples of the signal
plt.plot(Y[:, 0], label='Sample Signal 1')
plt.plot(Y[:, 1], label='Sample Signal 2')
plt.legend()
plt.title("Examples of Sparse Coded Signals")
plt.show()

# Split the dataset into input and output elements for modeling
X = Y
y = D
print(f"Input shape: {X.shape}")
print(f"Output shape: {y.shape}")
Running the example gives an output like:
Y shape: (100, 50)
D shape: (30, 50)
X shape: (100, 30)
Summary statistics of Y:
               0           1           2   ...          47          48          49
count  100.000000  100.000000  100.000000  ...  100.000000  100.000000  100.000000
mean     0.046717   -0.005957   -0.024672  ...   -0.050389    0.012739   -0.012666
std      0.369739    0.257843    0.302706  ...    0.367152    0.310589    0.265665
min     -1.047285   -0.680177   -0.735008  ...   -0.993624   -0.962513   -0.771926
25%     -0.159927   -0.177210   -0.183959  ...   -0.289227   -0.149502   -0.210982
50%      0.059625    0.008276   -0.041801  ...   -0.030809    0.058228   -0.028959
75%      0.238204    0.149700    0.153542  ...    0.191789    0.212554    0.119700
max      1.223809    0.754771    0.971347  ...    0.598670    0.824755    0.811608

[8 rows x 50 columns]
First few columns of Y:
[[ 5.77355384e-02  1.57677676e-01 -1.17613002e-01 -5.02683669e-01
   2.86536269e-03]
 [-2.29485908e-02 -3.44071521e-02 -6.06119229e-02 -2.45943666e-01
  -1.98112709e-02]
 [-3.35079429e-01 -2.72668394e-01 -4.06664422e-01  1.99284776e-01
  -5.36498321e-02]
 [ 1.26066405e-01 -4.07859963e-02 -1.81544373e-01 -2.04683068e-01
   5.30330616e-01]
...
Input shape: (100, 50)
Output shape: (30, 50)

The steps are as follows:
Import the
make_sparse_coded_signalfunction fromsklearn.datasetsandmatplotlib.pyplotfor plotting:- This function allows us to create a synthetic sparse coded signal dataset.
Generate the dataset using
make_sparse_coded_signal():- Specify
n_samples,n_components,n_features, andn_nonzero_coefsto define the structure of the signal. - Use
random_stateto ensure reproducibility.
- Specify
Print the shapes of the generated matrices
Y,D, andX:- This helps understand the dimensions of the signal, dictionary, and sparse code.
Display summary statistics of the signal matrix
Y:- Use pandas to get a statistical summary of the generated signal.
Display the first few columns of the signal matrix
Y:- Print initial values to get a sense of the signal content.
Plot examples of the generated signals:
- Use
matplotlibto visualize sample signals for better understanding.
- Use
Split the dataset into input and output elements:
- Assign
YtoX(input) andDtoy(output) for further modeling.
- Assign
This example demonstrates how to quickly generate and explore a synthetic sparse coded signal using scikit-learn’s make_sparse_coded_signal() function. This sets the stage for further exploration in sparse coding and dictionary learning tasks.
