
The make_moons function generates a synthetic dataset of two interleaving half circles, commonly used for binary classification tasks.
Key function arguments include n_samples to specify the number of samples to generate, noise to add Gaussian noise to the data, and random_state to ensure reproducibility.
This is a binary classification problem where algorithms like Logistic Regression, Decision Trees, and k-Nearest Neighbors are often applied.
from sklearn.datasets import make_moons
import matplotlib.pyplot as plt
# Generate the dataset
X, y = make_moons(n_samples=300, noise=0.2, random_state=42)
# Display dataset shape and types
print(f"Input shape: {X.shape}")
print(f"Output shape: {y.shape}")
# Show first few rows of the dataset
print(f"First few rows of inputs:\n{X[:5]}")
print(f"First few target values:\n{y[:5]}")
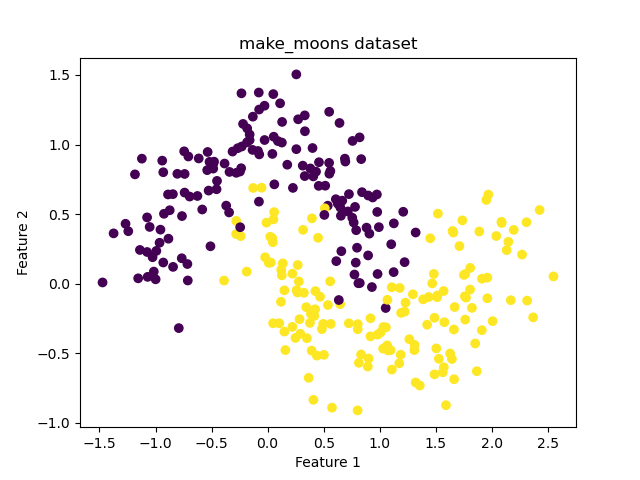
# Plot the dataset
plt.scatter(X[:, 0], X[:, 1], c=y, cmap='viridis')
plt.xlabel('Feature 1')
plt.ylabel('Feature 2')
plt.title('make_moons dataset')
plt.show()
Running the example gives an output like:
Input shape: (300, 2)
Output shape: (300,)
First few rows of inputs:
[[ 0.80392642 -0.29140734]
 [ 2.31443265 -0.12223813]
 [-0.28039207  0.45093754]
 [ 0.78944629  0.38405983]
 [ 1.18665653 -0.51143769]]
First few target values:
[1 1 1 0 1]
The steps are as follows:
Import the
make_moonsfunction fromsklearn.datasetsandmatplotlib.pyplot:make_moonsgenerates a synthetic dataset of two interleaving half circles.matplotlib.pyplotis used for plotting the dataset.
Generate the dataset using
make_moons():- Use
n_samples=300to create a dataset with 300 samples. - Add Gaussian noise to the data with
noise=0.2to make the classification task more realistic. - Set
random_state=42for reproducibility.
- Use
Print the dataset shape:
- Access the input shape using
X.shape. - Access the output shape using
y.shape.
- Access the input shape using
Display the first few rows of the dataset:
- Print the first five input samples using
X[:5]. - Print the first five target values using
y[:5].
- Print the first five input samples using
Plot the dataset:
- Use
plt.scatter()to visualize the dataset, coloring points by their class. - Label the axes and give the plot a title for clarity.
- Use
This example demonstrates how to generate and visualize a synthetic binary classification dataset using scikit-learn’s make_moons() function, allowing you to explore its structure and characteristics. This prepares you for applying and testing various classification algorithms.