
The make_gaussian_quantiles function generates a synthetic dataset suitable for classification tasks. This dataset is created by drawing samples from multivariate normal distributions and then assigning labels based on quantiles of the distribution.
Key function arguments include n_samples to specify the number of samples, n_features for the number of features, and n_classes to determine the number of classes.
This is a multiclass classification problem where algorithms like Logistic Regression, K-Nearest Neighbors, and Decision Trees can be applied.
from sklearn.datasets import make_gaussian_quantiles
import matplotlib.pyplot as plt
import pandas as pd
# Generate the dataset
X, y = make_gaussian_quantiles(n_samples=1000, n_features=2, n_classes=3, random_state=42)
# Display dataset shape and types
print(f"Dataset shape: {X.shape}")
print(f"Input feature types: {type(X)}, Output feature types: {type(y)}")
# Show summary statistics
print(f"Summary statistics:\n{pd.DataFrame(X).describe()}")
# Display first few rows of the dataset
print(f"First few rows of the dataset:\n{pd.DataFrame(X).head()}")
# Plot the dataset
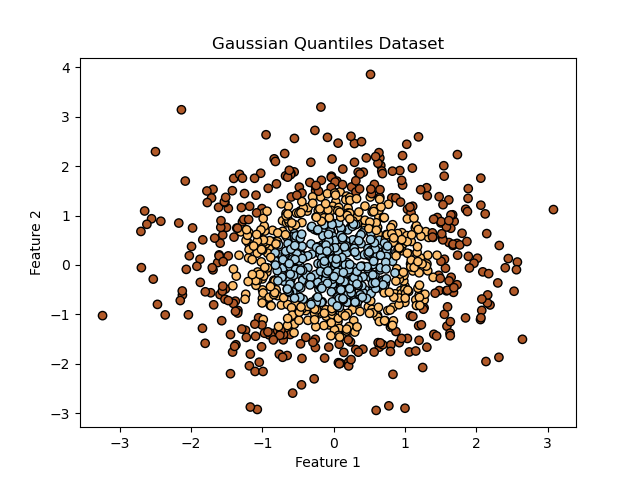
plt.scatter(X[:, 0], X[:, 1], c=y, edgecolor='k', cmap=plt.cm.Paired)
plt.xlabel('Feature 1')
plt.ylabel('Feature 2')
plt.title('Gaussian Quantiles Dataset')
plt.show()
Running the example gives an output like:
Dataset shape: (1000, 2)
Input feature types: <class 'numpy.ndarray'>, Output feature types: <class 'numpy.ndarray'>
Summary statistics:
                 0            1
count  1000.000000  1000.000000
mean      0.033186     0.056982
std       0.961603     1.014959
min      -3.241267    -2.940389
25%      -0.611581    -0.651418
50%       0.036043     0.047742
75%       0.648317     0.714886
max       3.078881     3.852731
First few rows of the dataset:
          0         1
0  1.644968 -0.249036
1  1.189470 -1.227608
2  0.069802 -0.385314
3  1.846637 -1.070085
4  0.361636 -0.645120
The steps are as follows:
Import the
make_gaussian_quantilesfunction fromsklearn.datasetsandmatplotlib.pyplotfor plotting:- This function allows us to generate a synthetic dataset with Gaussian quantiles.
Generate the dataset using
make_gaussian_quantiles():- Use
n_samplesto specify the number of samples (e.g., 1000). - Use
n_featuresto determine the number of features (e.g., 2 for easy visualization). - Use
n_classesto specify the number of classes (e.g., 3). - Set
random_statefor reproducibility.
- Use
Print the dataset shape and types:
- Access the shape using
X.shape. - Show the data types using
type(X)for input andtype(y)for output.
- Access the shape using
Display summary statistics:
- Use
pd.DataFrame(X).describe()to get a statistical summary of the dataset.
- Use
Display the first few rows of the dataset:
- Print the initial rows using
pd.DataFrame(X).head()to get a sense of the dataset structure and content.
- Print the initial rows using
Plot the dataset:
- Use
plt.scatter()to visualize the data points in a 2D space, colored by their class labels. - Set labels and title for the plot.
- Use
This example demonstrates how to quickly generate and explore a synthetic dataset using scikit-learn’s make_gaussian_quantiles() function, allowing you to inspect the data’s shape, types, summary statistics, and visualize it. This sets the stage for further preprocessing and application of classification algorithms.