
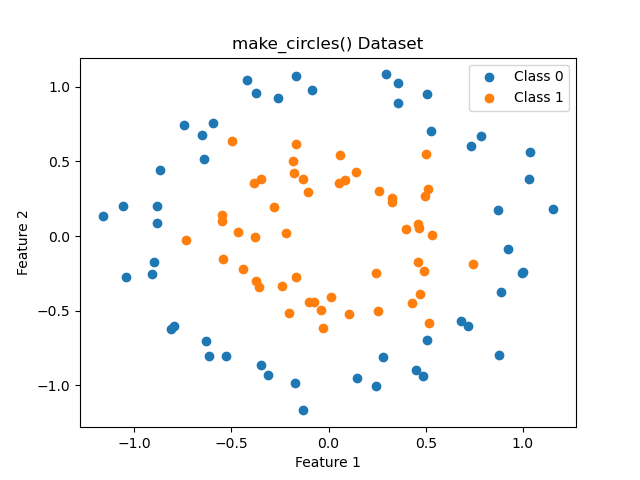
Generating synthetic data for classification tasks can be crucial for testing and validating machine learning algorithms. The make_circles() function in scikit-learn creates a two-dimensional binary classification dataset with a circular decision boundary, often used to evaluate the performance of classifiers on non-linear problems.
Key function arguments include n_samples to specify the number of samples, noise to add Gaussian noise to the data, and factor to define the distance between the circles.
This is a binary classification problem where algorithms like Support Vector Machines with non-linear kernels, k-Nearest Neighbors, and neural networks are often applied.
from sklearn.datasets import make_circles
import matplotlib.pyplot as plt

# Generate the dataset
X, y = make_circles(n_samples=100, noise=0.1, factor=0.5, random_state=42)

# Display dataset shape and types
print(f"Dataset shape: {X.shape}")
print(f"Feature types: {type(X)}, {type(y)}")

# Show summary statistics
import numpy as np
print(f"Summary statistics:\nX mean: {np.mean(X, axis=0)}, X std: {np.std(X, axis=0)}")

# Display first few rows of the dataset
print(f"First few rows of the dataset:\nX[:5], y[:5]")

# Plot the dataset
plt.scatter(X[y == 0][:, 0], X[y == 0][:, 1], label='Class 0')
plt.scatter(X[y == 1][:, 0], X[y == 1][:, 1], label='Class 1')
plt.legend()
plt.xlabel('Feature 1')
plt.ylabel('Feature 2')
plt.title('make_circles() Dataset')
plt.show()

# Split the dataset into input and output elements
print(f"Input shape: {X.shape}")
print(f"Output shape: {y.shape}")
Running the example gives an output like:
Dataset shape: (100, 2)
Feature types: <class 'numpy.ndarray'>, <class 'numpy.ndarray'>
Summary statistics:
X mean: [ 0.00478926 -0.00396879], X std: [0.56309332 0.56890655]
First few rows of the dataset:
X[:5], y[:5]
Input shape: (100, 2)
Output shape: (100,)
Import the
make_circlesfunction fromsklearn.datasetsandmatplotlib.pyplotfor plotting:make_circlesis used to create synthetic circular data.matplotlib.pyplotis used to visualize the data.
Generate the dataset using
make_circles():- Use
n_samples=100to create 100 samples. - Add
noise=0.1for variability. - Set
factor=0.5to determine the distance between the inner and outer circles. - Use
random_state=42for reproducibility.
- Use
Print the dataset shape and feature types:
- Access the shape using
X.shape. - Show the data types of the features and target using
type(X)andtype(y).
- Access the shape using
Display summary statistics:
- Calculate and print the mean and standard deviation of
Xusingnp.mean(X, axis=0)andnp.std(X, axis=0).
- Calculate and print the mean and standard deviation of
Display the first few rows of the dataset:
- Print the initial rows using
X[:5]andy[:5]to get a sense of the dataset structure and content.
- Print the initial rows using
Plot the dataset:
- Use
plt.scatter()to plot the data points, distinguishing classes by color and labels.
- Use
Split the dataset into input and output elements:
- Confirm the split by printing the shapes of
Xandy.
- Confirm the split by printing the shapes of
This example demonstrates how to use scikit-learn’s make_circles() function to generate and explore a synthetic dataset, visualize its structure, and prepare it for machine learning tasks.