
The make_checkerboard function in scikit-learn allows you to create a synthetic checkerboard dataset, which is useful for clustering or classification tasks. This example demonstrates how to generate and visualize a checkerboard dataset.
The make_checkerboard function generates a synthetic dataset consisting of a checkerboard pattern, useful for testing clustering algorithms. Key arguments include shape to specify the data shape, n_clusters to define the number of clusters, and noise to add Gaussian noise.
This synthetic dataset is ideal for clustering algorithms like K-Means or hierarchical clustering.
from sklearn.datasets import make_checkerboard
import matplotlib.pyplot as plt

# Generate the checkerboard dataset
data, rows, cols = make_checkerboard(shape=(20, 20), n_clusters=(3, 3), noise=0.1, random_state=42)

# Display dataset shape and types
print(f"Data shape: {data.shape}")
print(f"Rows shape: {rows.shape}")
print(f"Cols shape: {cols.shape}")

# Show summary statistics
print(f"Summary statistics for data:\n{data[:5]}")

# Display a portion of the dataset
print(f"First few rows of data:\n{data[:5]}")
print(f"First few rows of rows:\n{rows[:5]}")
print(f"First few rows of cols:\n{cols[:5]}")

# Plot the checkerboard pattern
plt.matshow(data)
plt.title('Checkerboard Pattern')
plt.show()
Running the example gives an output like:
Data shape: (20, 20)
Rows shape: (9, 20)
Cols shape: (9, 20)
Summary statistics for data:
[[15.32226908 15.23974701 15.2669484  24.13671461 23.78042274 23.97655933
  15.4834739  23.88929004 23.94926936 24.12332215 23.98453962 23.96526615
  24.09927888 23.96917245 15.16749971 23.99670222 15.17598153 23.82554476
  23.98358983 23.98916066]
 [85.01746858 85.03987883 85.10583437 11.7681908  11.70804349 97.51946282
  84.87664345 11.89837213 11.86149179 11.81828436 11.90187314 97.39023713
  97.33250936 97.33924943 84.90874448 97.29885196 85.10144645 97.29732175
  11.97971831 11.9296908 ]
 [73.7256503  73.80359983 73.60686595 88.05076742 87.90353431 63.92114655
  73.84702429 88.04125059 88.04894653 87.93193064 87.95706777 64.03904159
  64.05567371 64.29158282 73.65661734 64.07324701 73.79323761 64.20687377
  87.91506158 87.98201543]
 [15.13946597 15.30489514 15.06919567 24.04112485 23.98831276 24.06137066
  15.12661656 24.08061253 24.0255021  24.01873259 23.93952242 24.14870606
  24.12768293 24.31733813 15.09285729 23.91299492 15.17371093 24.1588708
  24.07078104 23.97812167]
 [73.71280482 73.63023044 73.72307904 87.9704393  87.86908901 64.37379327
  73.58589147 87.87867504 88.04990668 87.81886601 87.99830174 64.07639161
  64.1097276  64.22128925 73.73073001 64.18821841 73.82425    64.15414706
  88.03285086 88.08269207]]
First few rows of data:
[[15.32226908 15.23974701 15.2669484  24.13671461 23.78042274 23.97655933
  15.4834739  23.88929004 23.94926936 24.12332215 23.98453962 23.96526615
  24.09927888 23.96917245 15.16749971 23.99670222 15.17598153 23.82554476
  23.98358983 23.98916066]
 [85.01746858 85.03987883 85.10583437 11.7681908  11.70804349 97.51946282
  84.87664345 11.89837213 11.86149179 11.81828436 11.90187314 97.39023713
  97.33250936 97.33924943 84.90874448 97.29885196 85.10144645 97.29732175
  11.97971831 11.9296908 ]
 [73.7256503  73.80359983 73.60686595 88.05076742 87.90353431 63.92114655
  73.84702429 88.04125059 88.04894653 87.93193064 87.95706777 64.03904159
  64.05567371 64.29158282 73.65661734 64.07324701 73.79323761 64.20687377
  87.91506158 87.98201543]
 [15.13946597 15.30489514 15.06919567 24.04112485 23.98831276 24.06137066
  15.12661656 24.08061253 24.0255021  24.01873259 23.93952242 24.14870606
  24.12768293 24.31733813 15.09285729 23.91299492 15.17371093 24.1588708
  24.07078104 23.97812167]
 [73.71280482 73.63023044 73.72307904 87.9704393  87.86908901 64.37379327
  73.58589147 87.87867504 88.04990668 87.81886601 87.99830174 64.07639161
  64.1097276  64.22128925 73.73073001 64.18821841 73.82425    64.15414706
  88.03285086 88.08269207]]
First few rows of rows:
[[ True False False  True False  True False  True False False False  True
  False False  True False False False False False]
 [ True False False  True False  True False  True False False False  True
  False False  True False False False False False]
 [ True False False  True False  True False  True False False False  True
  False False  True False False False False False]
 [False False  True False  True False  True False False False  True False
   True False False  True  True  True  True  True]
 [False False  True False  True False  True False False False  True False
   True False False  True  True  True  True  True]]
First few rows of cols:
[[False False False  True  True False False  True  True  True  True False
  False False False False False False  True  True]
 [False False False False False  True False False False False False  True
   True  True False  True False  True False False]
 [ True  True  True False False False  True False False False False False
  False False  True False  True False False False]
 [False False False  True  True False False  True  True  True  True False
  False False False False False False  True  True]
 [False False False False False  True False False False False False  True
   True  True False  True False  True False False]]
Import the
make_checkerboardfunction fromsklearn.datasetsandmatplotlib.pyplot:- These libraries are used to generate and visualize the checkerboard dataset.
Generate the checkerboard dataset using
make_checkerboard():- Set
shape=(20, 20)for a 20x20 data matrix. - Use
n_clusters=(3, 3)to create a 3x3 checkerboard pattern. - Add noise with
noise=0.1for realistic data variation. - Set
random_state=42for reproducibility.
- Set
Print the dataset shape and feature types:
- Access the shape of
data,rows, andcolsarrays using.shape.
- Access the shape of
Display summary statistics:
- Print the first few rows of the
data,rows, andcolsarrays to inspect the dataset.
- Print the first few rows of the
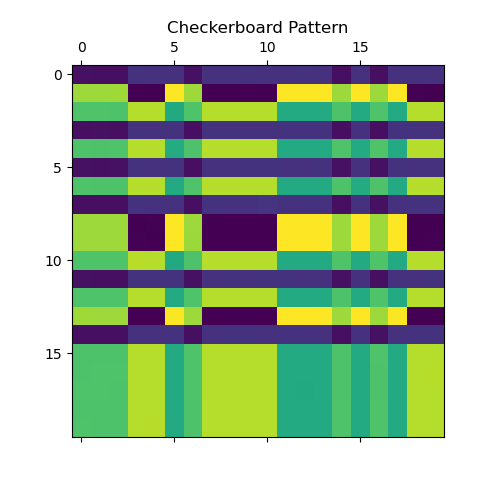
Plot the checkerboard pattern:
- Use
plt.matshow(data)to visualize the checkerboard pattern. - Set the title of the plot to ‘Checkerboard Pattern’.
- Use
This example demonstrates how to generate and visualize a synthetic checkerboard dataset using scikit-learn’s make_checkerboard() function. This synthetic dataset is useful for testing clustering algorithms and understanding their behavior on structured data.