
Generate and utilize a synthetic dataset with make_blobs for clustering tasks, which creates Gaussian blobs of points for testing clustering algorithms.
The make_blobs function generates isotropic Gaussian blobs suitable for clustering.
It is ideal for creating simple, controlled datasets to test clustering algorithms. Key arguments include n_samples to specify the number of data points, n_features for the number of features per sample, centers for the number of cluster centers or their fixed locations, and cluster_std for the standard deviation of the clusters.
This dataset is for clustering problems, where algorithms like K-Means, DBSCAN, and Gaussian Mixture Models are often appropriate.
from sklearn.datasets import make_blobs
import matplotlib.pyplot as plt
# Generate the dataset
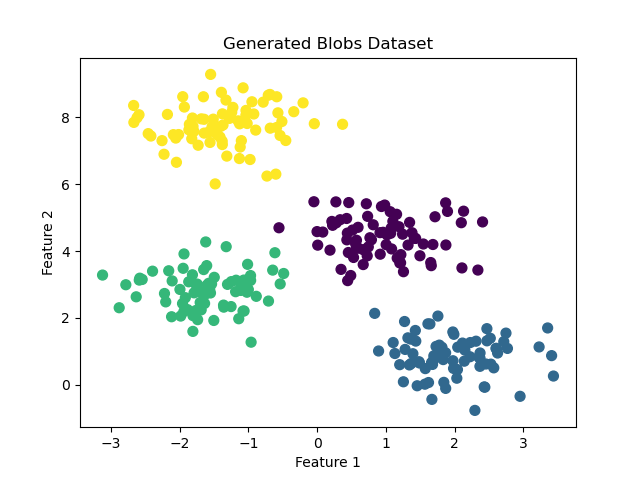
X, y = make_blobs(n_samples=300, n_features=2, centers=4, cluster_std=0.60, random_state=0)
# Display dataset shape and types
print(f"Dataset shape: {X.shape}")
print(f"First few rows of the dataset:\n{X[:5]}")
# Plot the dataset
plt.scatter(X[:, 0], X[:, 1], c=y, s=50, cmap='viridis')
plt.xlabel('Feature 1')
plt.ylabel('Feature 2')
plt.title('Generated Blobs Dataset')
plt.show()
# Split the dataset into input and output elements
print(f"Input shape: {X.shape}")
print(f"Output shape: {y.shape}")
Running the example gives an output like:
Dataset shape: (300, 2)
First few rows of the dataset:
[[ 0.83685684  2.13635938]
 [-1.4136581   7.40962324]
 [ 1.15521298  5.09961887]
 [-1.01861632  7.81491465]
 [ 1.27135141  1.89254207]]

Input shape: (300, 2)
Output shape: (300,)
Import the
make_blobsfunction fromsklearn.datasetsandmatplotlib.pyplotfor plotting:- This function generates synthetic data suitable for clustering.
Generate the dataset using
make_blobs():- Specify
n_samples=300to create 300 data points. - Use
n_features=2for a 2-dimensional dataset. - Set
centers=4to generate 4 clusters. - Adjust
cluster_std=0.60for the standard deviation of the clusters. - Use
random_state=0for reproducibility.
- Specify
Print the dataset shape and display the first few rows:
- Show the shape using
X.shape. - Print the first five rows of the dataset with
X[:5]to inspect the data.
- Show the shape using
Plot the dataset:
- Use
plt.scatter()to create a scatter plot of the generated data points, colored by their cluster label. - Label the axes and give the plot a title.
- Use
Split the dataset into input and output elements:
- Confirm the shapes of the feature set
Xand the labelsy.
- Confirm the shapes of the feature set
This example demonstrates how to generate and visualize a synthetic dataset using make_blobs, which can be useful for testing and experimenting with various clustering algorithms.