
The make_biclusters function from scikit-learn is used to create a synthetic dataset with biclusters, useful for testing biclustering algorithms.
The dataset has a rectangular structure where rows and columns represent clusters.
Key function arguments include shape to define the dimensions, n_clusters to set the number of clusters, and noise to add Gaussian noise.
This example will show how to generate and explore a bicluster dataset, which is suitable for clustering algorithms like Spectral Biclustering and Spectral Co-Clustering.
from sklearn.datasets import make_biclusters
import matplotlib.pyplot as plt
# Generate the bicluster dataset
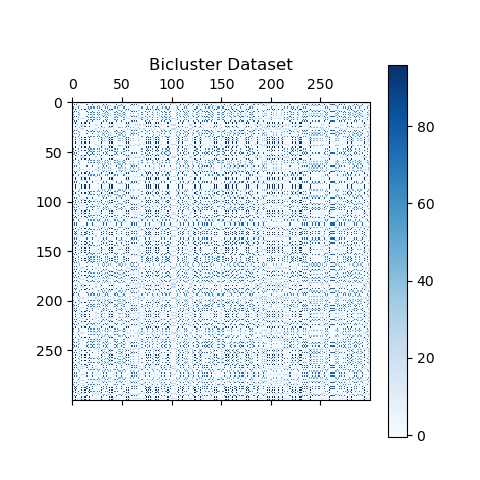
data, rows, columns = make_biclusters(shape=(300, 300), n_clusters=5, noise=0.1, random_state=42)
# Display dataset shape
print(f"Dataset shape: {data.shape}")
# Report summary statistics
print(f"Summary statistics:\n{data[:5, :5]}")
# Plot the dataset
plt.matshow(data, cmap=plt.cm.Blues)
plt.title("Bicluster Dataset")
plt.colorbar()
plt.show()
# Split the dataset into input and cluster labels
X = data
y = rows
print(f"Input shape: {X.shape}")
print(f"Cluster labels shape: {y.shape}")
Running the example gives an output like:
Dataset shape: (300, 300)
Summary statistics:
[[-9.85836962e-02  6.39047939e+01  1.74070831e-02 -5.83040451e-02
  -3.47657187e-04]
 [ 2.40573536e+01  1.37372720e-01 -9.18707127e-02 -9.59893970e-02
   6.55866384e-02]
 [ 3.08499595e-02  1.04896532e-01  7.59162172e+01 -1.85525740e-01
   7.59096263e+01]
 [-6.59746209e-03  2.07563754e-01  7.42859480e-02 -7.47441682e-03
  -4.47431808e-03]
 [ 9.29741673e-03  6.39480030e+01 -7.64993047e-02 -2.38614490e-02
   9.62999294e-02]]

Input shape: (300, 300)
Cluster labels shape: (5, 300)
Import the
make_biclustersfunction fromsklearn.datasetsandmatplotlib.pyplot:- These libraries will be used to create and visualize the synthetic bicluster dataset.
Generate the bicluster dataset using
make_biclusters():- Set
shape=(300, 300)for a 300x300 matrix. - Define
n_clusters=5for creating 5 biclusters. - Use
noise=0.1to add a small amount of Gaussian noise for realism. - Set
random_state=42for reproducibility.
- Set
Print the dataset shape:
- Confirm the dimensions using
data.shape.
- Confirm the dimensions using
Report summary statistics:
- Display the first few values of the dataset using
data[:5, :5].
- Display the first few values of the dataset using
Plot the dataset:
- Visualize the biclusters with
plt.matshow(data, cmap=plt.cm.Blues). - Add a colorbar and title for clarity.
- Visualize the biclusters with
Split the dataset into input and cluster labels:
- Separate the bicluster matrix (
X) from the cluster labels (y). - Print the shapes of
Xandyto confirm the split.
- Separate the bicluster matrix (
This example demonstrates how to generate a synthetic bicluster dataset using scikit-learn’s make_biclusters() function, allowing you to inspect the data’s shape, summary statistics, and visualize the biclusters. This sets the stage for applying biclustering algorithms and further analysis.