
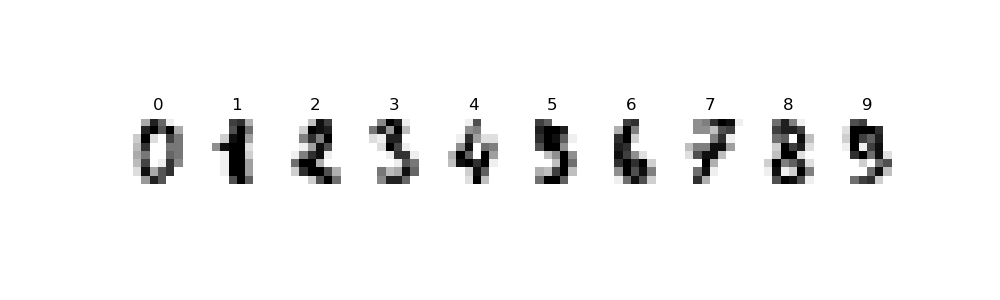
The Digits dataset contains 8x8 pixel grayscale images of handwritten digits (0-9) and is commonly used for practicing image classification tasks.
Key function arguments when loading the dataset include return_X_y to specify if data should be returned as a tuple, and as_frame to get the data as a pandas DataFrame.
This is a multiclass classification problem where common algorithms like K-Nearest Neighbors, Support Vector Machines, and Neural Networks are often applied.
from sklearn.datasets import load_digits
import matplotlib.pyplot as plt

# Load the dataset
dataset = load_digits(as_frame=True)

# Display dataset shape and types
print(f"Dataset shape: {dataset.data.shape}")
print(f"Feature types:\n{dataset.data.dtypes}")

# Show summary statistics
print(f"Summary statistics:\n{dataset.data.describe()}")

# Display first few rows of the dataset
print(f"First few rows of the dataset:\n{dataset.data.head()}")

# Plot examples from the dataset
fig, axes = plt.subplots(1, 10, figsize=(10, 3))
for ax, (image, label) in zip(axes, zip(dataset.images, dataset.target)):
    ax.set_axis_off()
    ax.imshow(image, cmap=plt.cm.gray_r, interpolation='nearest')
    ax.set_title(f'{label}')
plt.show()

# Split the dataset into input and output elements
X = dataset.data
y = dataset.target
print(f"Input shape: {X.shape}")
print(f"Output shape: {y.shape}")
Running the example gives an output like:
Dataset shape: (1797, 64)
Feature types:
pixel_0_0    float64
pixel_0_1    float64
pixel_0_2    float64
pixel_0_3    float64
pixel_0_4    float64
              ...
pixel_7_3    float64
pixel_7_4    float64
pixel_7_5    float64
pixel_7_6    float64
pixel_7_7    float64
Length: 64, dtype: object
Summary statistics:
       pixel_0_0    pixel_0_1  ...    pixel_7_6    pixel_7_7
count     1797.0  1797.000000  ...  1797.000000  1797.000000
mean         0.0     0.303840  ...     2.067891     0.364496
std          0.0     0.907192  ...     4.090548     1.860122
min          0.0     0.000000  ...     0.000000     0.000000
25%          0.0     0.000000  ...     0.000000     0.000000
50%          0.0     0.000000  ...     0.000000     0.000000
75%          0.0     0.000000  ...     2.000000     0.000000
max          0.0     8.000000  ...    16.000000    16.000000

[8 rows x 64 columns]
First few rows of the dataset:
   pixel_0_0  pixel_0_1  pixel_0_2  ...  pixel_7_5  pixel_7_6  pixel_7_7
0        0.0        0.0        5.0  ...        0.0        0.0        0.0
1        0.0        0.0        0.0  ...       10.0        0.0        0.0
2        0.0        0.0        0.0  ...       16.0        9.0        0.0
3        0.0        0.0        7.0  ...        9.0        0.0        0.0
4        0.0        0.0        0.0  ...        4.0        0.0        0.0

[5 rows x 64 columns]

Input shape: (1797, 64)
Output shape: (1797,)
Import the
load_digitsfunction fromsklearn.datasetsandmatplotlib.pyplot:- This function loads the Digits dataset and
matplotlib.pyplotis used for plotting images.
- This function loads the Digits dataset and
Load the dataset using
load_digits():- Use
as_frame=Trueto return the dataset as a pandas DataFrame for easier data manipulation and analysis.
- Use
Print the dataset shape and feature types:
- Access the shape using
dataset.data.shape. - Show the data types of the features using
dataset.data.dtypes.
- Access the shape using
Display summary statistics:
- Use
dataset.data.describe()to get a statistical summary of the dataset.
- Use
Display the first few rows of the dataset:
- Print the initial rows using
dataset.data.head()to get a sense of the dataset structure and content.
- Print the initial rows using
Plot examples from the dataset:
- Use
matplotlibto visualize some of the handwritten digit images.
- Use
Split the dataset into input and output elements:
- Separate the features (
X) from the target variable (y). - Print the shapes of
Xandyto confirm the split.
- Separate the features (
This example demonstrates how to load and explore the Digits dataset using load_digits(), visualize the data, and prepare it for machine learning tasks.