
The Laplacian kernel is a similarity metric used for pairwise distance calculations between data points in scikit-learn. It calculates the similarity between two points based on their Euclidean distance, with the similarity decreasing exponentially as the distance increases.
The Laplacian kernel is defined as k(x, y) = exp(-gamma * ||x - y||), where ||x - y|| represents the Euclidean distance between points x and y, and gamma is a parameter that controls the width of the kernel. Higher gamma values lead to a more localized influence of each point, meaning that the similarity drops off more quickly with distance.
This kernel is useful for tasks such as density estimation, anomaly detection, and support vector machines. However, it is sensitive to the choice of the gamma parameter, and it may not capture complex patterns in the data as effectively as some other kernels.
from sklearn.datasets import make_classification
from sklearn.metrics.pairwise import laplacian_kernel
import numpy as np
import seaborn as sns
import matplotlib.pyplot as plt

# Generate a synthetic 2D dataset with two classes
X, y = make_classification(n_samples=100, n_features=2, n_redundant=0, n_classes=2, random_state=42)

# Calculate pairwise distances using laplacian_kernel with different gamma values
gamma_values = [0.1, 1, 10]
kernel_matrices = []

for gamma in gamma_values:
    kernel_matrix = laplacian_kernel(X, gamma=gamma)
    kernel_matrices.append(kernel_matrix)

# Visualize the similarity matrices as heatmaps
fig, axs = plt.subplots(1, 3, figsize=(15, 5))

for i, (ax, kernel_matrix) in enumerate(zip(axs, kernel_matrices)):
    sns.heatmap(kernel_matrix, cmap='viridis', ax=ax)
    ax.set_title(f'Laplacian Kernel (gamma={gamma_values[i]})')
    ax.set_xlabel('Data Points')
    ax.set_ylabel('Data Points')

plt.tight_layout()
plt.show()
Running the example gives an output like:
The steps in this example are:
Generate a synthetic 2D dataset with two classes using
make_classification()from scikit-learn.Calculate the pairwise distance matrix using
laplacian_kernel()with differentgammavalues. We use three differentgammavalues (0.1, 1, and 10) to demonstrate the effect of this parameter on the similarity calculations.Visualize the similarity matrices as heatmaps using seaborn’s
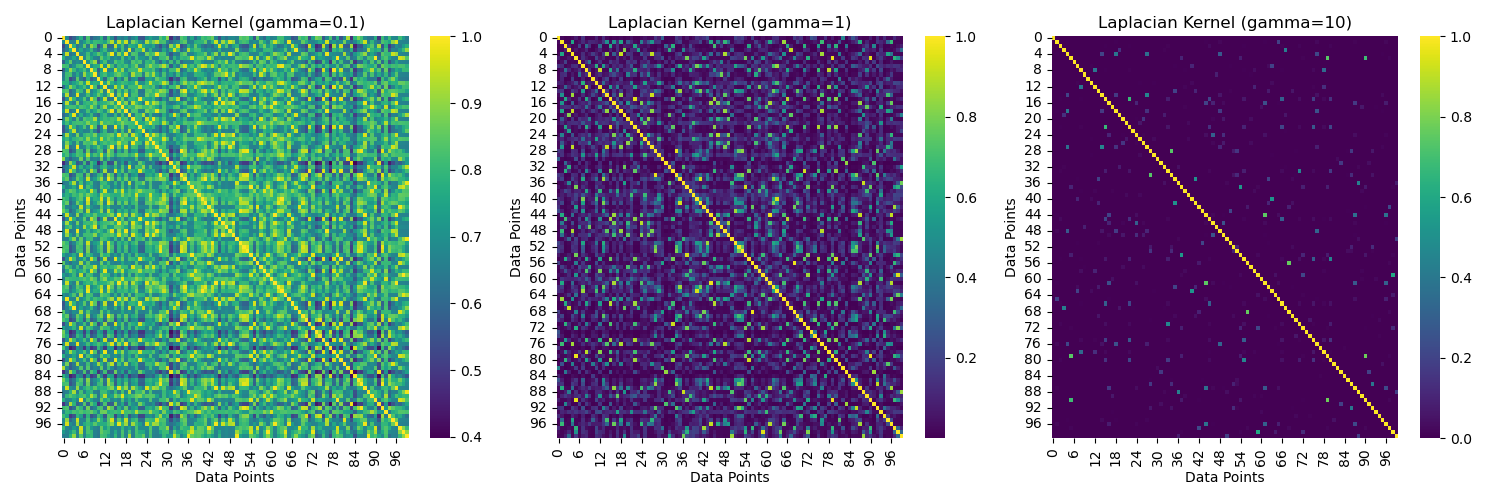
heatmap()function. Each heatmap represents the pairwise similarities between data points calculated using the Laplacian kernel with a specificgammavalue.Analyze the effect of
gammaon the similarity values and the localization of influence. Asgammaincreases, the similarity values become more concentrated along the diagonal, indicating that the influence of each point becomes more localized. With lowergammavalues, the similarity spreads more broadly across the matrix.
This example demonstrates how to use the laplacian_kernel() function from scikit-learn to calculate pairwise distances between data points and visualize the effect of the gamma parameter on the resulting similarity matrices.