Kernel Principal Component Analysis (KernelPCA) is an extension of PCA that uses kernel methods to perform non-linear dimensionality reduction. It maps data into a higher-dimensional space to make it more linearly separable.
The key hyperparameters of KernelPCA include n_components (number of components), kernel (type of kernel), and gamma (kernel coefficient for certain kernels like RBF).
This algorithm is suitable for dimensionality reduction in classification and regression problems where non-linear relationships are present.
from sklearn.datasets import make_moons
from sklearn.decomposition import KernelPCA
import matplotlib.pyplot as plt

# generate 2D dataset with non-linear patterns
X, y = make_moons(n_samples=100, noise=0.1, random_state=1)

# create KernelPCA instance
kpca = KernelPCA(n_components=2, kernel='rbf', gamma=15)

# fit and transform the dataset
X_kpca = kpca.fit_transform(X)

# plot the original and the transformed datasets
plt.figure(figsize=(12, 5))

# original dataset
plt.subplot(1, 2, 1)
plt.scatter(X[:, 0], X[:, 1], c=y)
plt.title('Original Dataset')

# transformed dataset
plt.subplot(1, 2, 2)
plt.scatter(X_kpca[:, 0], X_kpca[:, 1], c=y)
plt.title('KernelPCA Transformed Dataset')

plt.show()
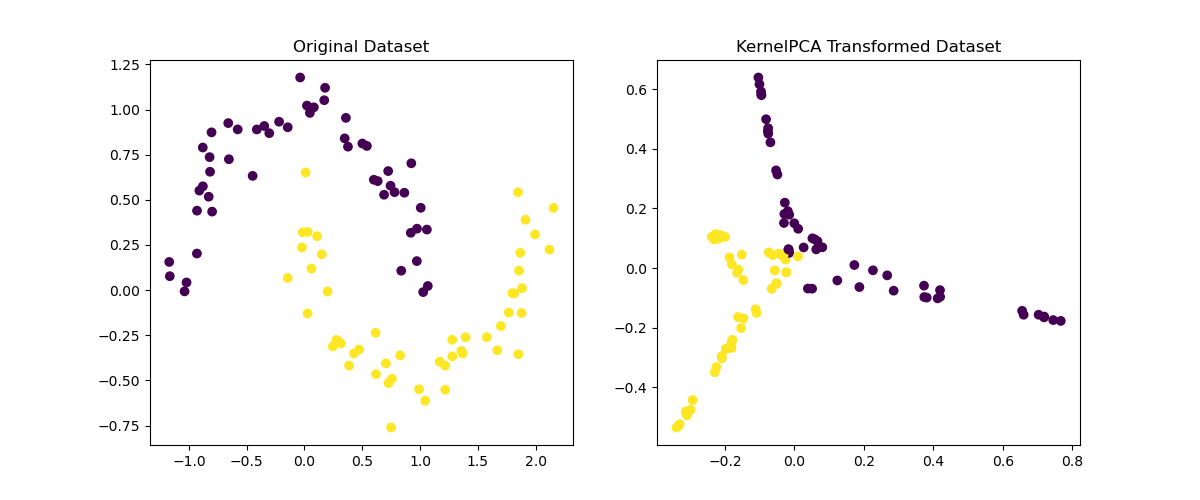
Running the example gives an output like:

The steps are as follows:
- Generate a synthetic dataset using
make_moons()to create a 2D dataset with non-linear patterns. This dataset contains two interleaving half circles. - Create a
KernelPCAmodel withn_componentsset to 2,kernelset to ‘rbf’ (Radial Basis Function), andgammaset to 15. - Fit and transform the dataset using the
fit_transform()method ofKernelPCA. - Plot the original dataset and the transformed dataset to visualize the effect of KernelPCA on non-linear data. The transformation helps to separate the data points into distinct clusters.
This example demonstrates the application of KernelPCA for non-linear dimensionality reduction, showcasing how it can make complex data structures more manageable and separable.
