
Isomap is a nonlinear dimensionality reduction technique that seeks to preserve the geodesic distances between data points. It can be useful for visualizing high-dimensional datasets that lie on a low-dimensional manifold.
The key hyperparameters of Isomap include the number of neighbors used to construct the graph (n_neighbors) and the maximum number of components to retain (n_components).
As an unsupervised learning algorithm, Isomap is well-suited for exploratory data analysis and visualization of complex datasets.
from sklearn.datasets import make_s_curve
from sklearn.manifold import Isomap
import matplotlib.pyplot as plt
# Generate a synthetic dataset with a nonlinear structure
X, _ = make_s_curve(n_samples=500, noise=0.1, random_state=42)
# Create an Isomap instance
isomap = Isomap(n_neighbors=10, n_components=2)
# Fit the model and transform the data
X_iso = isomap.fit_transform(X)
# Visualize the transformed data
plt.figure(figsize=(8, 6))
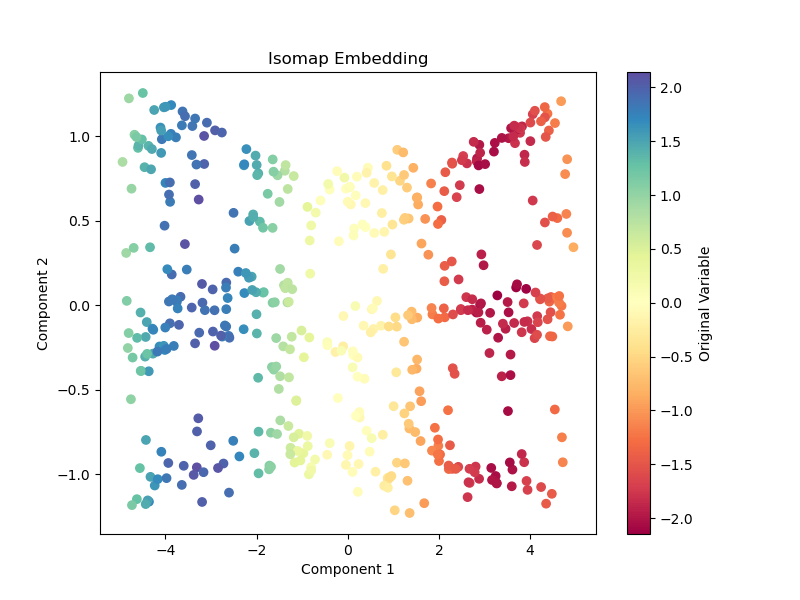
plt.scatter(X_iso[:, 0], X_iso[:, 1], c=X[:, 2], cmap=plt.cm.Spectral)
plt.colorbar(label='Original Variable')
plt.xlabel('Component 1')
plt.ylabel('Component 2')
plt.title('Isomap Embedding')
plt.show()
Running the example produces a plot the looks like:
The steps in this example are:
A synthetic dataset with a nonlinear structure is generated using
make_s_curve(). This dataset has three dimensions, but the underlying structure is a 2D manifold.An
Isomapinstance is created, specifying the number of neighbors (n_neighbors=10) used to construct the graph and the number of components to retain (n_components=2).The
fit_transform()method is called to fit the Isomap model on the dataset and transform it to a lower-dimensional representation.The transformed data is visualized using a scatter plot, with points colored according to their value on the original third variable. This plot reveals the underlying 2D structure of the data.
This example demonstrates how Isomap can effectively unfold a nonlinear manifold and represent it in a lower-dimensional space, facilitating visualization and understanding of the data’s underlying structure.