HDBSCAN (Hierarchical Density-Based Spatial Clustering of Applications with Noise) is an advanced clustering algorithm that extends DBSCAN by converting it into a hierarchical clustering method and then extracting the flat clustering based on the stability of clusters. This algorithm is particularly useful for clustering data with varying densities.
The key hyperparameters of HDBSCAN include min_cluster_size (minimum size of clusters) and min_samples (number of samples in a neighborhood for a point to be considered a core point).
HDBSCAN is appropriate for density-based clustering problems.
import numpy as np
from sklearn.datasets import make_blobs
from sklearn.preprocessing import StandardScaler
from sklearn.cluster import HDBSCAN
import matplotlib.pyplot as plt

# generate sample data
X, _ = make_blobs(n_samples=300, centers=4, cluster_std=0.5, random_state=0)

# standardize features
X = StandardScaler().fit_transform(X)

# fit the model
model = HDBSCAN(min_cluster_size=10, min_samples=5)
model.fit(X)

# predict cluster labels
labels = model.labels_

# plot the clusters
plt.scatter(X[:, 0], X[:, 1], c=labels, cmap='viridis')
plt.title('HDBSCAN Clustering')
plt.show()
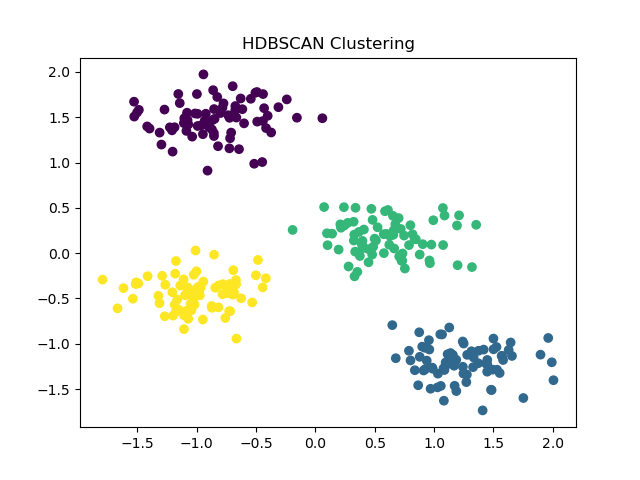
Running the example gives an output like:

The steps are as follows:
Generate a synthetic dataset using
make_blobs()with 300 samples and 4 centers. Standardize the features usingStandardScaler()to ensure all features contribute equally to the distance calculations.Instantiate the
HDBSCANmodel withmin_cluster_sizeset to 10 andmin_samplesset to 5. These parameters control the minimum size of clusters and the sensitivity to noise, respectively.Fit the model on the standardized dataset using the
fit()method.Predict the cluster labels using the fitted model’s
labels_attribute.Visualize the resulting clusters with a scatter plot, coloring each point according to its cluster label.
This example demonstrates how to set up and use the HDBSCAN algorithm for clustering tasks, particularly when dealing with datasets that have varying densities. The model automatically identifies clusters of varying densities and can also identify noise points that do not belong to any cluster.
