
GaussianRandomProjection is a dimensionality reduction technique that projects data to a lower-dimensional space using a random Gaussian matrix. It is useful for reducing the number of features while preserving the structure of the data.
The key hyperparameters include n_components (number of dimensions to project the data into) and eps (parameter to control the quality of the embedding).
This technique is appropriate for preprocessing steps in both classification and regression tasks.
from sklearn.datasets import make_classification
from sklearn.random_projection import GaussianRandomProjection
import matplotlib.pyplot as plt

# generate synthetic dataset
X, y = make_classification(n_samples=100, n_features=10, n_classes=2, random_state=1)

# create GaussianRandomProjection model
grp = GaussianRandomProjection(n_components=2)

# fit and transform the dataset
X_transformed = grp.fit_transform(X)

# plot the transformed dataset
plt.scatter(X_transformed[:, 0], X_transformed[:, 1], c=y)
plt.title('2D Projection using GaussianRandomProjection')
plt.xlabel('Component 1')
plt.ylabel('Component 2')
plt.show()
Running the example gives an output like:
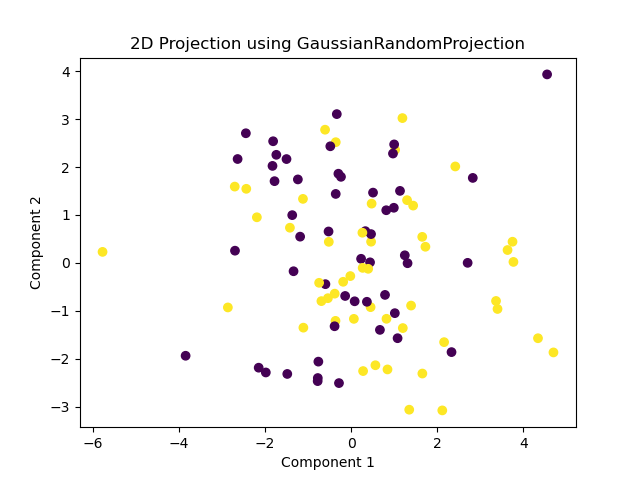
The steps are as follows:
- Generate a synthetic binary classification dataset using
make_classification(). This creates a dataset with specified samples (n_samples), features (n_features), and classes (n_classes). Set a fixed random seed (random_state) for reproducibility. - Create a
GaussianRandomProjectionmodel withn_componentsset to 2, indicating a 2D projection. - Fit and transform the dataset using the
fit_transform()method to project the data into a 2D space. - Plot the transformed dataset using
matplotlibto visualize the lower-dimensional representation, color-coded by class labels.