
FastICA (Fast Independent Component Analysis) is an algorithm used to separate a multivariate signal into additive, independent components. It is commonly applied in the field of signal processing and is useful for blind source separation problems.
The key hyperparameters of FastICA include n_components (number of components to extract), algorithm (the algorithm used to perform the ICA), and whiten (whether to whiten the data).
The algorithm is appropriate for dimensionality reduction and feature extraction tasks.
from sklearn.datasets import make_blobs
from sklearn.decomposition import FastICA
import matplotlib.pyplot as plt
import numpy as np
# generate synthetic dataset
X, _ = make_blobs(n_samples=300, n_features=2, centers=3, random_state=1)
# add some noise
np.random.seed(0)
X += 0.2 * np.random.normal(size=X.shape)
# create FastICA instance
ica = FastICA(n_components=2, random_state=1)
# fit and transform the data
X_transformed = ica.fit_transform(X)
# plot the transformed data
plt.scatter(X_transformed[:, 0], X_transformed[:, 1], marker='o')
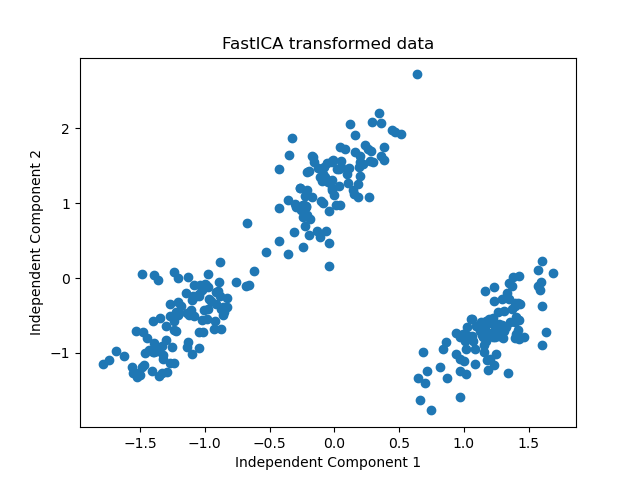
plt.title('FastICA transformed data')
plt.xlabel('Independent Component 1')
plt.ylabel('Independent Component 2')
plt.show()
Running the example gives a plot like:
Running the example gives an output like:
First, a synthetic dataset is generated using
make_blobs()to create a simple dataset with 3 centers and 2 features. Some random noise is added to simulate real-world data.Next, a
FastICAinstance is created withn_componentsset to 2, meaning the algorithm will try to find 2 independent components. Therandom_stateparameter ensures reproducibility.The
FastICAmodel is fit on the dataset and then used to transform the data, extracting the independent components.Finally, the transformed data is plotted using
matplotlibto visualize the independent components.
This example demonstrates how to apply FastICA to a synthetic dataset to extract independent components, showcasing its utility in dimensionality reduction and feature extraction tasks. The transformed data is visualized to show the separation of the components.