
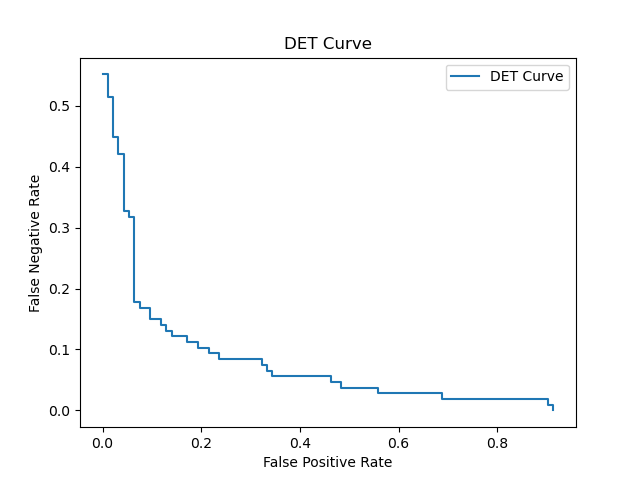
DET (Detection Error Tradeoff) curve is used to evaluate the performance of classification models.
The DET curve plots the false positive rate (FPR) against the false negative rate (FNR), providing a visual representation of the tradeoffs between these two types of errors.
This metric is useful for binary classification problems where the tradeoff between FPR and FNR is important.
It is especially relevant in fields like biometric verification and medical diagnosis. However, the DET curve is not suitable for multiclass classification problems.
from sklearn.datasets import make_classification
from sklearn.model_selection import train_test_split
from sklearn.svm import SVC
from sklearn.metrics import det_curve
import matplotlib.pyplot as plt

# Generate synthetic dataset
X, y = make_classification(n_samples=1000, n_classes=2, random_state=42)

# Split into train and test sets
X_train, X_test, y_train, y_test = train_test_split(X, y, test_size=0.2, random_state=42)

# Train an SVM classifier
clf = SVC(kernel='linear', C=1, probability=True, random_state=42)
clf.fit(X_train, y_train)

# Predict probabilities on test set
y_prob = clf.predict_proba(X_test)[:, 1]

# Calculate DET curve
fpr, fnr, thresholds = det_curve(y_test, y_prob)

# Plot DET curve
plt.plot(fpr, fnr, label='DET Curve')
plt.xlabel('False Positive Rate')
plt.ylabel('False Negative Rate')
plt.title('DET Curve')
plt.legend()
plt.show()
Running the example gives an output like:
The steps are as follows:
- Generate a synthetic binary classification dataset using the
make_classification()function. - Split the dataset into training and test sets using the
train_test_split()function. - Train an SVM classifier with a linear kernel and enable probability estimation using
SVC(probability=True). - Use the trained classifier to predict probabilities on the test set with
predict_proba(). - Calculate the DET curve using the
det_curve()function, which returns false positive rates, false negative rates, and thresholds. - Plot the DET curve using
matplotlibto visualize the tradeoff between false positive rates and false negative rates.
This example demonstrates how to use the det_curve() function from scikit-learn to evaluate the performance of a binary classification model by plotting the DET curve.