
BayesianGaussianMixture is a variational Bayesian estimation of a Gaussian mixture model, useful for unsupervised clustering of unlabeled data.
The key hyperparameters of BayesianGaussianMixture include n_components (the number of mixture components), covariance_type (the type of covariance matrix, such as full, tied, diagonal, or spherical), and max_iter (the maximum number of EM iterations to perform).
This algorithm is appropriate for unsupervised clustering problems where the goal is to group similar data points together without any prior knowledge of the group assignments.
from sklearn.datasets import make_blobs
from sklearn.mixture import BayesianGaussianMixture
import matplotlib.pyplot as plt

# generate dataset
X, _ = make_blobs(n_samples=400, centers=4, cluster_std=0.60, random_state=0)

# create model
model = BayesianGaussianMixture(n_components=4)

# fit model
model.fit(X)

# get cluster assignments
yhat = model.predict(X)

# plot clusters
plt.scatter(X[:, 0], X[:, 1], c=yhat, s=50, cmap='viridis')
plt.show()
Running the example produces a plot the looks like:
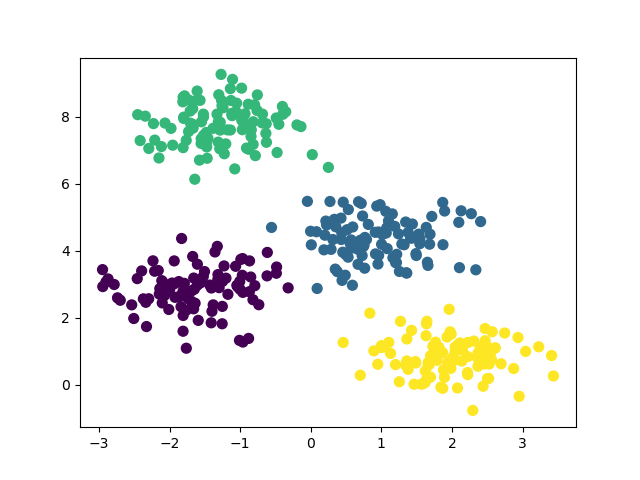
The steps are as follows:
First, a synthetic dataset is generated using the
make_blobs()function. This creates a dataset with a specified number of samples (n_samples), centers (centers), cluster standard deviation (cluster_std), and a fixed random seed (random_state) for reproducibility.Next, a
BayesianGaussianMixturemodel is instantiated with the number of components set to match the number of centers in the generated data. The model is then fit on the full dataset using thefit()method.The cluster assignments for each data point are obtained by calling the
predict()method on the fit model.Finally, the data points are plotted using scatter plot, with colors representing the assigned clusters.
This example demonstrates how to use BayesianGaussianMixture for unsupervised clustering tasks, showcasing its ability to identify and group similar data points without any prior labeling. The resulting plot provides a visual representation of the clustered data.