Agglomerative Clustering is a hierarchical clustering algorithm that builds nested clusters by merging or splitting them successively. It is appropriate for tasks requiring the clustering of data into an unknown number of groups.
The key hyperparameters of AgglomerativeClustering include the n_clusters (number of clusters to find), affinity (metric used to compute the linkage), and linkage (method to merge clusters).
The algorithm is appropriate for clustering tasks in various domains such as customer segmentation, anomaly detection, and image compression.
from sklearn.datasets import make_blobs
from sklearn.cluster import AgglomerativeClustering
import matplotlib.pyplot as plt

# generate a synthetic dataset
X, _ = make_blobs(n_samples=100, centers=3, n_features=2, random_state=42)

# create the AgglomerativeClustering model
model = AgglomerativeClustering(n_clusters=3)

# fit the model to the data
model.fit(X)

# predict the cluster for each data point
yhat = model.labels_

# plot the clustered data
plt.scatter(X[:, 0], X[:, 1], c=yhat, cmap='viridis')
plt.title('Agglomerative Clustering')
plt.show()
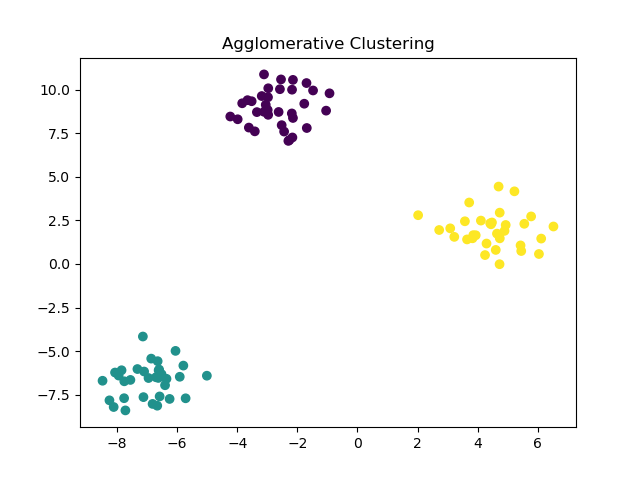
Running the example gives an output like:

The steps are as follows:
First, a synthetic dataset is generated using the
make_blobs()function. This creates a dataset with a specified number of samples (n_samples), centers (centers), features (n_features), and a fixed random seed (random_state) for reproducibility. The dataset is split into training and test sets usingtrain_test_split().Next, an
AgglomerativeClusteringmodel is instantiated withn_clustersset to 3. The model is then fit on the data using thefit()method.The clusters for each data point are predicted by accessing the
labels_attribute of the fitted model.The clustered data is visualized using a scatter plot with matplotlib, where the colors represent the different clusters.
This example demonstrates how to set up and use an AgglomerativeClustering model for clustering tasks. It showcases the ease of applying hierarchical clustering with scikit-learn and visualizing the results.
